
Table of Contents
- Do classic cars need an MOT? The short answer
- How many MOT-exempt cars still get an MOT?
- What happens to the MOT when a car turns 40
- Do classic cars pass the MOT?
- What do classic cars fail the MOT on?
- Which classics are tested most, and which pass?
- How many miles does a classic car do in a year?
- When and where classics get tested
- So should you MOT an exempt classic?
- Questions people ask
- How I counted, and the data
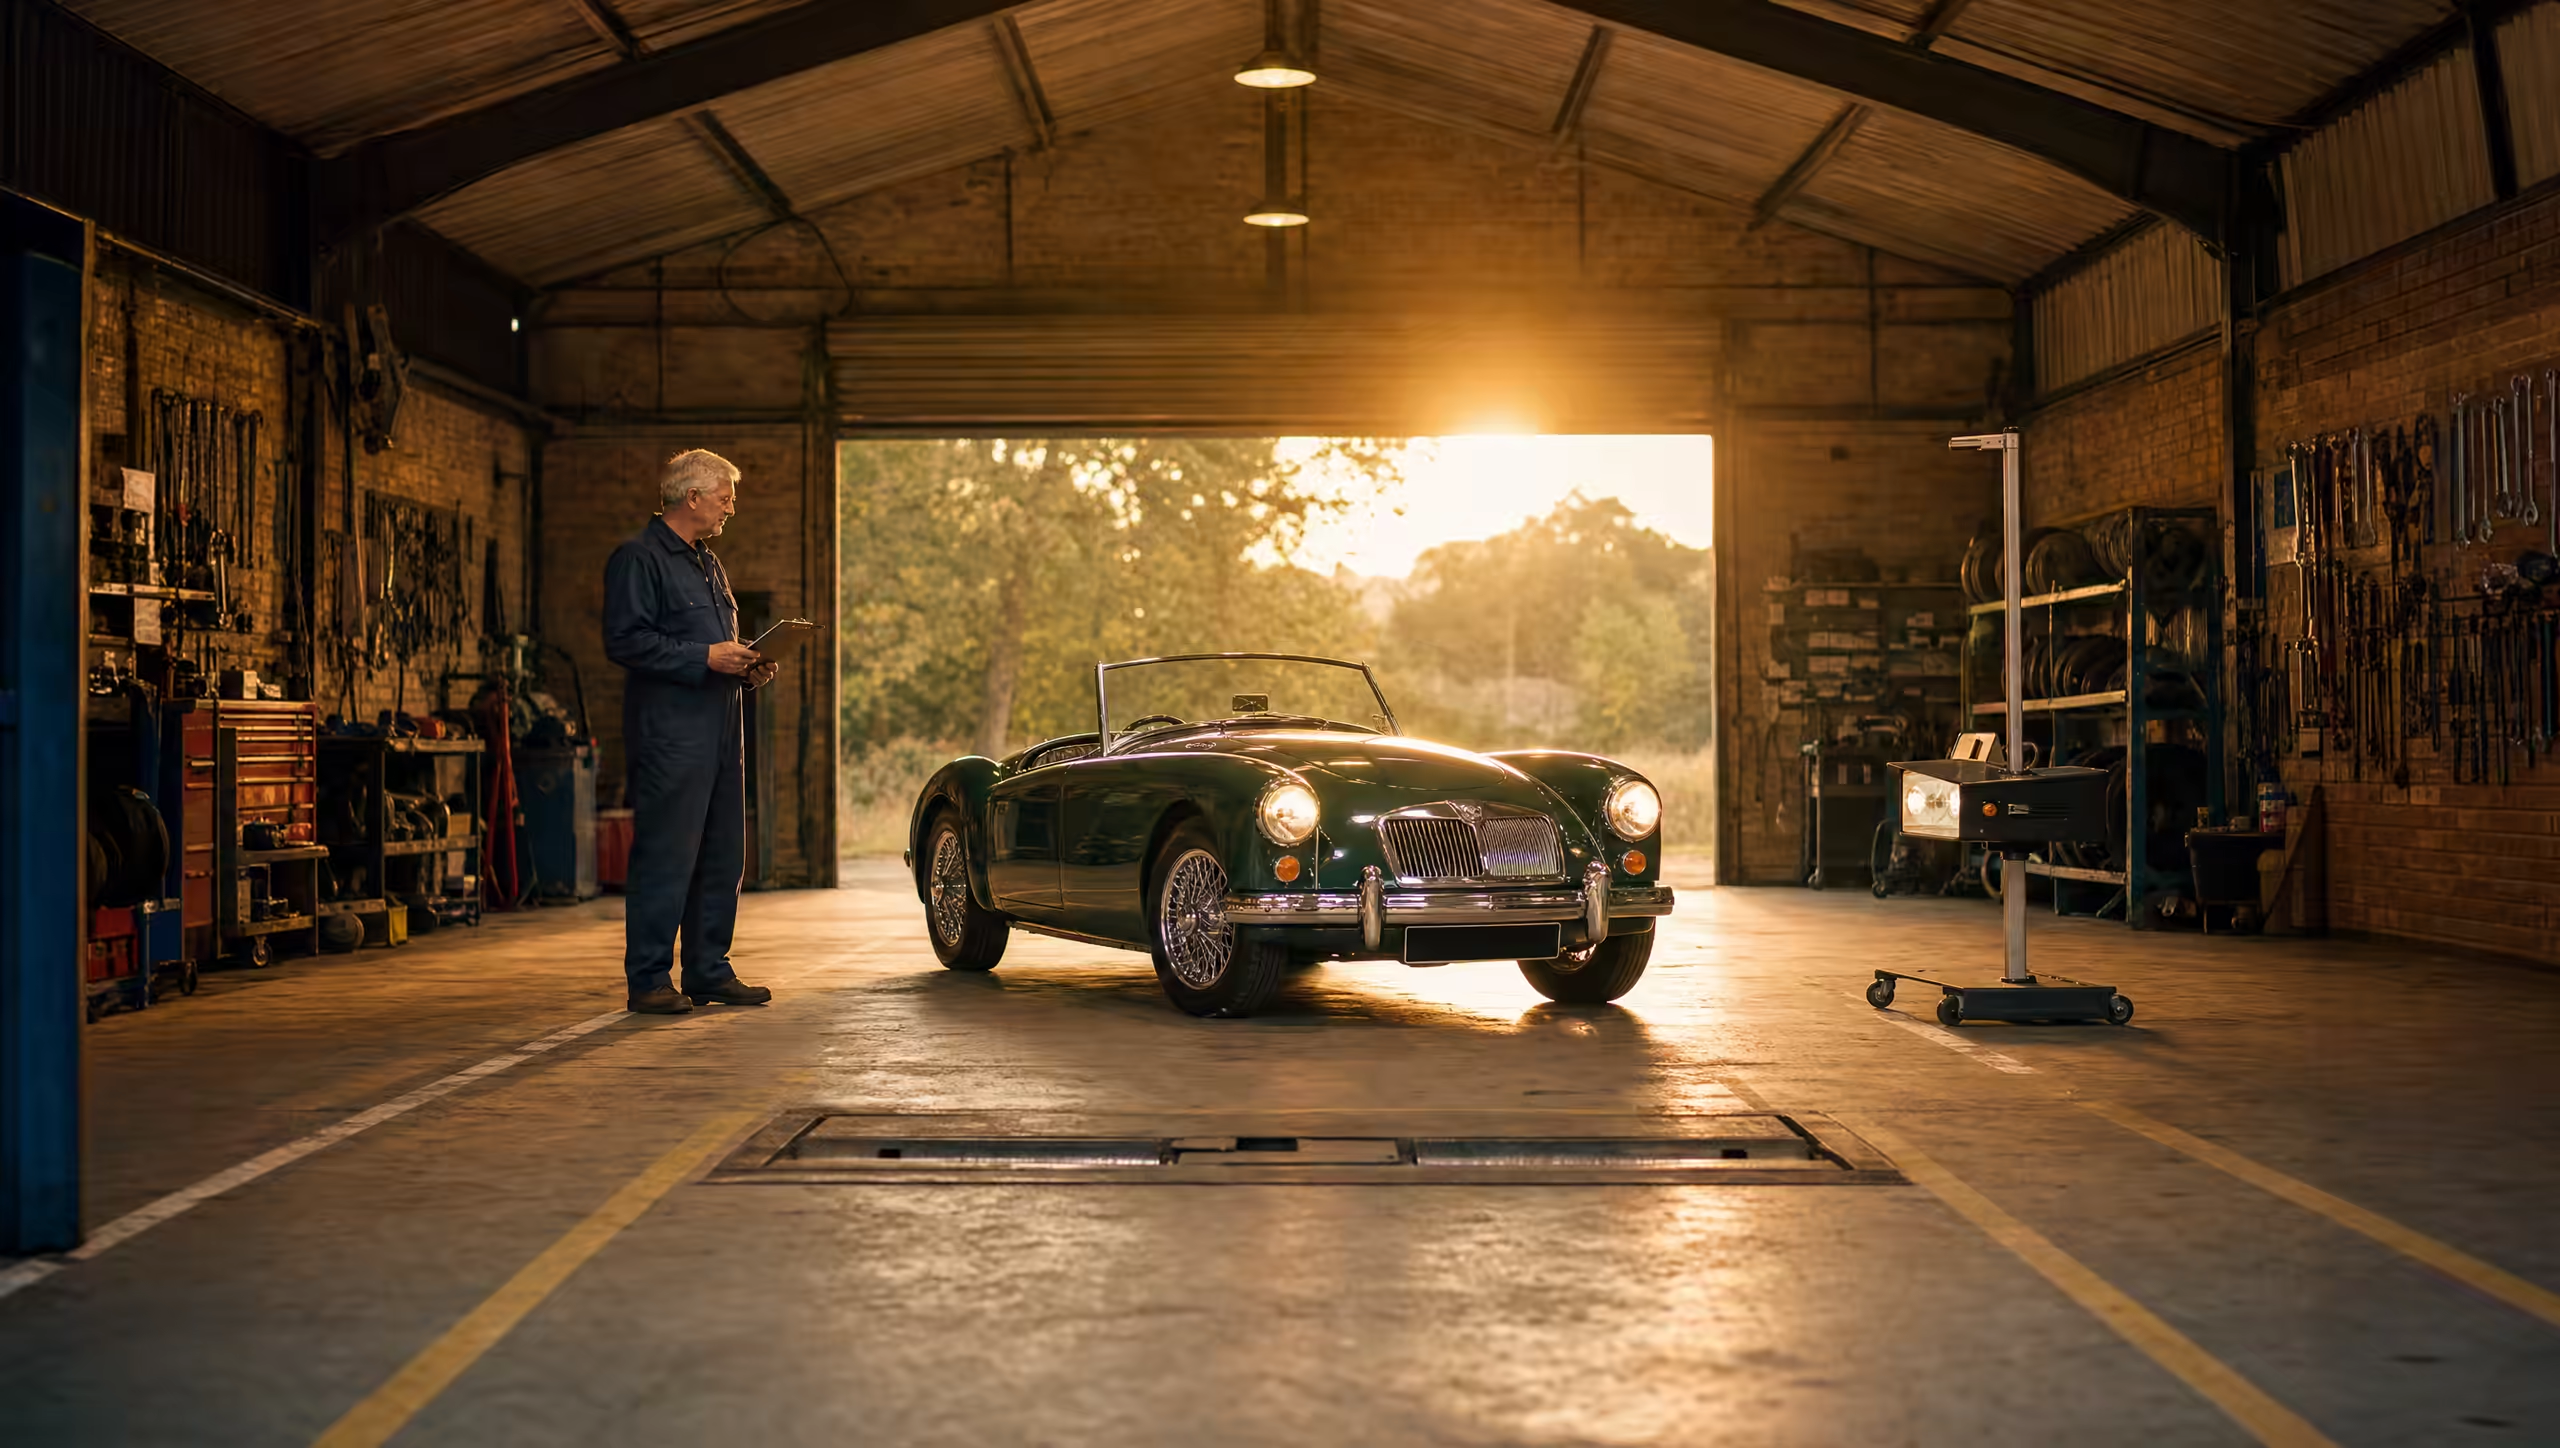
In September, Hagerty asked more than 1,200 enthusiasts what they made of the MOT. A car over 40 years old does not need one, and has not since 2018. Even so, 43 per cent told Hagerty they still put theirs through a test every year.
I wondered whether the test lanes would say the same. They are easy enough to ask, because the DVSA publishes a record of every MOT test in Great Britain with the number plates taken off. The file for 2025 came out in June. It has 42.7 million tests in it, and I went through the lot looking for cars old enough not to be there.
I found 50,216 tests on cars and light vans that were 40 or older on the day, covering 48,637 different vehicles. That sounds like plenty until you count the ones that stayed at home. There are about 442,000 cars and light vans on the road that were old enough to be exempt for the whole of 2025, and 45,830 of them saw a tester. That is about one in ten, and nearer one in 16 if you count the cars declared off the road as well.
So this is a piece about the one in ten: how they got on, what they failed on and how far they had been driven. It also turns out you can watch what owners do in the year a car turns 40 and they are first let off.
Do classic cars need an MOT? The short answer
Not once they are 40. In England, Scotland and Wales a car built or first registered more than 40 years ago needs no MOT, as long as it is a type no longer made and has not been substantially changed in the last 30 years. The date moves on a day at a time, so each car becomes exempt on its own 40th birthday. It still has to be roadworthy, and you can have it tested anyway for no more than £54.85.
The full rule, with the small print on what "substantially changed" means, is in our guide to classic car rules. The upshot is that every test in this piece on a car over 40 is, near enough, one that somebody chose to have.
Near enough, because a few were not a matter of choice. A car that has been substantially changed still needs an MOT at any age, and that takes in kit cars built on an older car's registration. So does an exempt car whose owner wants to move a private number plate on or off it. The records do not say why a car was tested. I can pick out about 570 tests on kit car makes, a little over 1% of the total, but not the rest. So I have kept away from the word voluntary. What I am counting is tests on cars old enough not to need one.
One more thing before the numbers. The MOT class that covers cars also covers light vans, pick-ups and campers, and the records do not tell them apart. So when I say cars from here on, a Land Rover and a Volkswagen camper are in there too.
How many MOT-exempt cars still get an MOT?
About 50,000 a year, and it has been about 50,000 a year for some time. There were 47,957 tests on cars over 40 in 2024 and 50,216 in 2025. Back in 2021 the DVSA told Retro Motor there had been more than 121,000 in the two and a half years to that June, which works out at roughly 48,000 a year.
The total only holds up because a fresh year of cars turns 40 every year and joins the count. Leave the newcomers out and it is falling. Cars first used in 1983 or earlier had 45,696 tests in 2024 and 43,545 in 2025, which is down 4.7%.
To turn tests into a share you need to know how many cars could have been tested. For that I used the same government licensing records as in last week's piece on what makes a classic car, which count every licensed vehicle by the year it was built. I kept to vehicles built in 1984 or earlier, because those were exempt for every day of 2025. And I counted licensed vehicles only, because a car declared off the road does not need an MOT at any age.
| Built | Licensed | Tested | Share |
|---|---|---|---|
| 1975 to 1984 | 99,604 | 18,634 | 18.7% |
| 1965 to 1974 | 170,843 | 20,150 | 11.8% |
| 1955 to 1964 | 90,650 | 5,359 | 5.9% |
| 1945 to 1954 | 34,511 | 902 | 2.6% |
| Before 1945 | 46,505 | 785 | 1.7% |
| All cars and light vans | 442,112 | 45,830 | 10.4% |
| Motorcycles | 255,726 | 5,778 | 2.3% |
The older the car, the less likely it is to be tested. Nearly one in five cars from the late 1970s and early 1980s still goes in. For a pre-war car it is one in 60. Motorcycles hardly bother at all: 6,648 tests in the year on bikes over 40, from a quarter of a million on the road.
If you would sooner count the cars declared off the road as well, there are another 280,000 of those, and the share drops to 6.3%, or one in 16. So the answer is somewhere between one in ten and one in 16, depending on whether a car asleep in a garage counts.
Hagerty and I are measuring different things. It asked owners and I am counting cars, so an owner with three classics who tests one of them is a yes in the survey and one car in three here. The people who answer questions about the MOT are also the keen ones, nine in ten of them owned a classic, and some of those classics will have been under 40 and tested because the law says so. The chap near Ludlow who takes his Austin Seven to the pub twice a summer does not fill in online forms. He does own one of the 442,000, though.
What happens to the MOT when a car turns 40
It falls off a step. This chart counts the cars that were tested in 2025 by the year they were first used. Anything from 1986 or later still needed its MOT. Anything from 1984 or earlier did not. Cars from 1985 crossed the line during the year.
There were 10,210 cars from 1986 tested, 7,875 from 1985 and 3,587 from 1984. A couple of years further back, with the 1982 cars, it is down to 1,628 and stays about there.
I can be more exact than a chart. Take the cars that passed an MOT between January and September 2024 while they were still 39, and whose certificate then ran out after their 40th birthday. There were 6,258 of them, and for each one the next test was the first it could skip. Just under half, 48.9%, came back in 2025.
That needs something to compare it with, because cars drop out of the test records every year for dull reasons. They get broken for parts or parked in a shed. Among cars a few years younger, which still had no choice, 77.7% came back, and it was between 76.5% and 79.2% for every age group I tried. So about half of the cars that had just turned 40 skipped their next MOT, against just over a fifth of the cars that still needed one.
It is not the rough ones dropping out, either. Of the cars that had failed at the first attempt in 2024, 46.9% came back. Of those that had passed first time, 49.5% did.
Tax seems to come into it. Cars from 1984 were tax free as well by 2025, and 40.9% of them came back. Cars from 1985 were MOT exempt but still paying road tax until April 2026, and 62.4% of them did. My guess is paperwork. Until a car is in the historic tax class its owner has to declare the exemption when the tax is renewed, and a fair few will find it easier to carry on getting the certificate.
It carries on after that. Of the cars that were already exempt in 2024 and were tested anyway, only 57.6% were tested again in 2025. A fair few owners seem to treat the MOT as a job for every other year, like the chimney.
Last week I showed that when a year's worth of cars turns 40 and goes tax free, the number licensed on 31 December roughly doubles. Follow the same cars through the test bay and the line goes the other way.
| Cars from 1984 | 2024 | 2025 | Change |
|---|---|---|---|
| Licensed, 31 December | 5,053 | 9,808 | Up 94% |
| MOT tested in year | 6,686 | 3,587 | Down 46% |
The two rows are different effects of the same birthday. The licensed number is the tax. Once it is free there is no reason to declare the car off the road for the winter, so far more of them are licensed on New Year's Eve. The 2024 figures back that up: more cars from 1984 were tested during the year (6,686) than were licensed at the end of it (5,053), which is what you would expect if they were out in the summer and laid up by Christmas. The tested number is the MOT. In 2024 most of these cars still needed a test for at least part of the year. In 2025 none of them did. On paper the class of 1984 doubled. In the test bay it nearly halved.
Do classic cars pass the MOT?
The ones that turn up do, and more often than almost anything else in the test bay. Of the cars over 40 tested in 2025, 17.9% failed at the first attempt. For cars of all ages it was 27.7%. That is not the same as saying old cars are safer, for reasons I will come to.
This is my favourite chart of the lot. A three-year-old car fails about one time in nine. From there the fail rate climbs with every birthday until it peaks at 43.0% for cars first used in 2006, which were 19. Then it turns round and comes all the way back down. A car from 1965 failed 12.4% of the time in 2025. A car from 2021 failed 12.8% of the time.
| First used | Tests | Failed |
|---|---|---|
| Before 1940 | 763 | 8.5% |
| 1940s | 221 | 9.5% |
| 1950s | 2,329 | 12.5% |
| 1960s | 11,740 | 14.5% |
| 1970s | 20,283 | 17.7% |
| 1980 to 1985 | 14,270 | 22.3% |
| 30 to 39 years old | 186,445 | 29.0% |
| All cars | 33,210,951 | 27.7% |
There are three reasons, and I cannot tell you how much each one is worth. The first is who is left. A 19-year-old hatchback is somebody's cheapest way to get to work. A 60-year-old saloon that is still on the road is somebody's pride and joy, and its rusty brothers were scrapped decades ago. The second is the test, which only checks what a car was built with. A petrol car first used before August 1975 is not put on the exhaust gas analyser at all, and a 1930s tourer has no anti-lock brakes, airbags or warning lights to go wrong. The third is that people who volunteer for an exam tend to have revised.
I would not lean too hard on the third. The cars that had just turned 40 came back in much the same numbers whether they had passed or failed the year before, so owners do not seem to be hiding the bad ones. And the line on the chart runs smoothly through the 40-year mark. Cars from 1986, which had to be there, failed 26.1% of the time. Cars from 1984, which did not, failed 23.9%.
Now the less comfortable number. In 1,987 of the tests on cars over 40 the tester found at least one fault and marked it dangerous, which means do not drive it away. That is 4.0% of tests, or one car in 25, and 2,719 dangerous faults in all. For cars aged 30 to 39 it was 5.7% of tests.
At the other end, 62.5% of the over-40s went through with a clean sheet: a pass with no advisories and nothing minor written down. For the 30 to 39 year olds it was 39.8%.
What do classic cars fail the MOT on?
Lamps come first and brakes second. This chart shows the share of failed tests that had a fault in each part of the car, for the over-40s and for cars ten years younger.
The old cars fail less often on rust and suspension than the 30-somethings do, and more often on brakes and on what the testers call visibility. That last one deserves a closer look. The single commonest fault on a failed classic in 2025 was the windscreen washers, with rust and brakes some way behind.
| Fault | Failed tests | Share |
|---|---|---|
| Screen washers not working, or not enough fluid | 1,829 | 20.6% |
| Headlamp aim out of limits | 1,238 | 14.0% |
| Brakes pulling unevenly across an axle | 1,063 | 12.0% |
| A sidelight or other lamp out | 930 | 10.5% |
| A headlamp out | 885 | 10.0% |
| Exhaust emissions over the limit | 835 | 9.4% |
| Handbrake not strong enough | 768 | 8.7% |
| A brake binding | 714 | 8.1% |
| Horn not working | 705 | 8.0% |
| Split steering gaiter or ball joint cover | 648 | 7.3% |
| Serious rust near a suspension mounting | 633 | 7.1% |
Nearly one failure in five involved a washer that did not squirt. One in 12 involved a horn that did not honk. These are five-minute jobs, and I would bet most of those owners knew about them and meant to get round to it.
The brake faults are a different matter, because they are the ones you cannot find on the drive. A car that pulls up straight and stops well enough at 30mph can still have one wheel doing far less than its opposite number, and only the rollers will show it. Brake faults of one kind or another are in 37% of the failures.
Rust is where the old cars score. Serious corrosion near a suspension mounting is in 12.2% of failures on cars aged 30 to 39, which puts it third in their list. On the over-40s it is in 7.1% and comes eleventh. By that age a car has either been welded or been weighed in.
Which classics are tested most, and which pass?
One test in every eleven on a car over 40 is an MGB. That will surprise nobody who has been to a car show.
The DVSA records model names as the tester or the logbook has them, which is to say every way going. The MGB appears under 35 different names and the Mini under 94. For this table I have merged the obvious ones by hand. The file at the end of the piece has all 293 models as recorded, if you want to look up your own.
| Car | Tests | Failed |
|---|---|---|
| MGB, roadster and GT | 4,384 | 18.3% |
| Volkswagen Transporter and campers | 2,891 | 36.7% |
| Ford Escort | 2,128 | 6.3% |
| Morris Minor | 1,918 | 20.9% |
| Mini | 1,781 | 20.6% |
| Land Rover Series, 88 and 109 | 1,646 | 25.8% |
| Triumph Stag | 1,233 | 18.1% |
| Land Rover 90 and 110 | 1,170 | 25.7% |
| Volkswagen Beetle | 992 | 22.2% |
| Jaguar E-type | 990 | 8.9% |
| MG Midget | 938 | 20.1% |
| Triumph TR6 | 817 | 14.7% |
| Ford Capri | 806 | 15.5% |
| Porsche 911 | 714 | 14.4% |
| Ford Cortina | 617 | 10.9% |
| Volkswagen Golf | 610 | 21.6% |
| Austin-Healey, all models | 559 | 14.3% |
| Triumph Spitfire | 495 | 21.2% |
| Triumph Herald and Vitesse | 473 | 19.2% |
| Lotus Elan | 315 | 9.2% |
| Citroen 2CV | 285 | 25.3% |
| Ford Anglia | 216 | 6.5% |
The Ford Escort is the star pupil, and it comes with an explanation. More than 2,000 were tested and only 6.3% failed, which is a better record than a three-year-old car manages. Then look at where they were tested. Nearly one in six went through a test station in the Swansea, Llandudno or Shrewsbury postcode areas, which between them see about one in 30 of all the tests on cars over 40. In the Swansea area a quarter of those tests were Escorts. That is rally country. A car rebuilt for rallying will often count as substantially changed, in which case it is not exempt and has to be there, and it tends to arrive straight from a workshop. Across Wales and the Marches the Escort failed 2.6% of the time. Everywhere else it failed 7.1% of the time, which is still the best of any common model, and there my guess is money. An old Escort is now worth more than the house it used to be parked outside, and nobody spends that sort of sum and then forgets the washer bottle. The Anglia is right behind on 6.5%, the E-type on 8.9% and the Elan on 9.2%.
At the other end are the Volkswagen vans, on 36.7%. My guess is that they are working vehicles with a kitchen in the back, they get driven to Cornwall fully loaded, and they rust in places that are hard to see. The Land Rovers and the 2CV fail about one time in four, and I say that as a friend to all three. None of this is a league table of good cars and bad ones. It is a count of what turned up, and who brought it.
By badge, MG leads with 6,658 tests, then Volkswagen (5,576), Ford (5,445), Triumph (4,739) and Land Rover (3,750). Rolls-Royce owners brought 796 cars in and 10.7% failed. Aston Martin managed 7.2% and Ferrari 7.7%.
One oddity. About a hundred of the tests were on electric cars more than 40 years old. They were Beetles, Fiat 500s, Land Rovers, a few 911s and a pair of E-types, so these are conversions and not milk floats.
How many miles does a classic car do in a year?
Every MOT records the odometer, and the records let you follow the same car from one year to the next. So for any car tested in both 2024 and 2025 you can work out how far it went in between. I found 27,739 cars over 40 with a sensible pair of readings. Only six in ten of the over-40s tested in 2025 had been tested the year before, so this is a picture of the cars that go in every year.
| Miles a year | Over 40 | Aged 30 to 39 |
|---|---|---|
| Under 100 | 20.5% | 16.7% |
| 100 to 499 | 34.9% | 25.6% |
| 500 to 999 | 19.7% | 17.2% |
| 1,000 to 1,999 | 15.1% | 17.4% |
| 2,000 to 4,999 | 8.1% | 16.4% |
| 5,000 or more | 1.7% | 6.6% |
The middle car did 412 miles in a year. That is eight miles a week. One in five did less than 100 miles between tests, three in four did less than 1,000, and 657 came back with exactly the same reading as the year before, which is either a very quiet year or a broken speedo cable.
The average is higher, because a few cars do proper mileages and pull it up. By my rules it comes to about 840 miles, and it moves between 740 and 870 depending on how you treat the handful of very large readings, some of which will be typing errors. For what it is worth, the Federation of British Historic Vehicle Clubs asked owners to estimate their mileage for its 2025 survey and got an average of 837. The two are not measuring the same thing. The Federation counts every historic vehicle over 30, motorbikes and lorries included, and mine are cars that were tested two years running. But an owner's guess and an odometer point the same way, which is that these cars do very few miles.
The cars aged 30 to 39 are the better guide to what a classic really does, because they still have to be tested and so nearly all of them are in the records. There were 131,187 of them with two readings. The middle one did 688 miles and the average was 1,509.
When and where classics get tested
Ordinary MOTs peak in March and again in September and October, in step with the new number plates. Old cars follow the weather. Almost half the year's tests on cars over 40 were done between April and July, and December managed 3.2%. Cars aged 30 to 39, which have no choice about being tested, keep much the same calendar. If you want a quiet word with your tester, go in January.
The records give the postcode area of the test station, which lets you see where old cars are tested most. I have counted tests on cars over 40 for every 10,000 MOT tests of all kinds in each area, so that big cities do not win just by being big.
Tunbridge Wells is the classic MOT capital of Britain. The TN postcode area, which takes in a good slice of Kent and East Sussex, carried out 1,525 tests on cars over 40 in the year, more than any other. That is one MOT in every 290 there, against one in 670 across Great Britain. Redhill, Dorchester, Hereford and Oxford are close behind. The surprise is London W. My guess is a handful of specialist garages in the west of the city that pull in cars from a long way off.
| Lowest areas | Tests | Rate |
|---|---|---|
| Glasgow (G) | 222 | 4.2 |
| Liverpool (L) | 166 | 4.6 |
| Manchester (M) | 253 | 5.1 |
| London E | 140 | 5.2 |
| Oldham (OL) | 130 | 5.7 |
| Harrow (HA) | 120 | 6.0 |
| Bolton (BL) | 152 | 6.0 |
| Cardiff (CF) | 331 | 6.1 |
Two warnings with this one. The area is where the garage is, and people take old cars a long way to a tester who understands them. And it is a share of all MOTs, so a city full of modern cars will always score low however many classics it has. It tells you where classics are tested, which is a decent guide to where they live but not a census.
So should you MOT an exempt classic?
Nothing here says the exemption is wrong, and nothing here says it is right. Skipping the test is entirely legal, and the DVSA has no record of the checks that owners, clubs and specialists do for themselves. The cars I can see are the ones that were shown to a tester. About one in six failed and one in 25 had something dangerous on it. What the records cannot tell anyone is the state of the rest. They might be better, since a car that does 400 miles a year from a dry garage does not wear much. They might be worse. Nobody knows, and that includes the Department for Transport.
What I take from it as an owner is smaller and more useful. The faults that fail these cars are mostly not the ones you notice from the driving seat. A brake doing less than its opposite number, a handbrake that holds on the flat but not on the rollers and a sidelight that went out in October are all easy to live with for years. A test costs no more than £54.85 and takes under an hour, and a fail on a car that does not need a pass is about the cheapest second opinion in motoring, provided you then act on it.
If you would sooner not, plenty of clubs know a garage that will put a car on the rollers and the ramp without the paperwork. Either way, check the washers first.
Questions people ask
Do classic cars need an MOT in the UK?
Not once they are more than 40 years old, as long as they are a type no longer made and have not been substantially changed in the last 30 years. The exemption starts on the car's own 40th birthday. You declare it when you tax the car. The car must still be roadworthy, and driving a dangerous one can cost up to £2,500 and three points.
Can you MOT a car that is exempt?
Yes. Any MOT station will test it, for no more than £54.85 for a car. In 2025 there were 50,216 tests in Great Britain on cars and light vans over 40.
How many MOT-exempt cars are still tested?
About one in ten of those licensed for the road. In 2025, 45,830 cars and light vans built in 1984 or earlier were tested, out of about 442,000. Counting the 280,000 declared off the road as well, it is one in 16. For cars built before 1945 it is fewer than one in 50.
How often do classic cars fail the MOT?
Of the cars over 40 tested in 2025, 17.9% failed at the first attempt, against 27.7% for cars of all ages. Pre-war cars failed 8.5% of the time and cars from 1980 to 1985 failed 22.3% of the time.
What do classic cars fail the MOT on most?
Lamps and electrics (a factor in 52.6% of failed tests), brakes (37.0%) and washers, wipers and view of the road (26.6%). The single commonest fault is screen washers that do not work or have no fluid, which turned up in 20.6% of failed tests.
How many miles a year does a classic car do?
Half of the cars over 40 that were tested in both 2024 and 2025 covered fewer than 412 miles between tests. The average was about 840 miles. For cars aged 30 to 39 the middle figure was 688 miles and the average 1,509.
How I counted, and the data
The tests come from the DVSA's anonymised MOT data for 2025 and 2024, which covers England, Scotland and Wales. Northern Ireland has its own testing system and is not in it. The licensed vehicle counts come from the Department for Transport and DVLA vehicle licensing statistics, table df_VEH0124. Both are published under the Open Government Licence.
- A test here means a first attempt, with a result of pass, fail, or pass after a fault was put right at the station. Retests are left out. A fail means either of the last two.
- A car is "over 40" if the 40th anniversary of its date of first use fell on or before the day of the test.
- Counts of tests and vehicles cover MOT classes 3, 4, 5 and 7, which is cars, light vans, campers and a few three-wheelers and minibuses. Pass rates, faults, models, months and areas use class 4 alone (49,606 of the 50,216 tests) so that they compare like with like.
- I left out 223 tests on vehicles with a first use date of 1 January 1971, which the DVLA uses when it does not know the real one, 39 with impossible dates and 30 with garbled model names.
- The share tested sets vehicles first used in 1984 or earlier against licensed cars and light goods vehicles built in 1984 or earlier, averaged over 31 December 2024 and 31 December 2025. It is not exact. The licensing figures include Northern Ireland, which is about 3% of the total, and a car can be tested while it is declared off the road. If every tested vehicle were a car, the share would be 12.9% of licensed cars. Against licensed and off-road vehicles together it is 6.3%. For cars from 1986 to 1995, which must be tested, the number tested comes to 120% of the number licensed on 31 December, because so many are taxed for the summer only. If the same were true of exempt cars the share of those on the road would be nearer 8.6%, though a tax-free car has no reason to be declared off the road for the winter.
- "Old enough to be exempt" is not the same as exempt. Substantially changed vehicles, kit cars on older registrations and cars having a number plate moved still need a test, and the records do not mark them. A few hundred imported cars also carry the date they were first registered here, not the date they were built, so they are counted as younger than they are.
- A dangerous fault is a failure item the tester marked as dangerous. I have counted tests with at least one.
- Mileage uses each car's last test in 2024 and last test in 2025 where both had a reading and they were 200 to 550 days apart. Where a five-figure odometer had plainly gone round the clock I added 100,000. I dropped pairs where the reading went down for any other reason, and anything over 30,000 miles a year.
- Area is the postcode area of the test station. The chart and table include areas with at least 100 tests on cars over 40.
- Faults are grouped by the wording of the defect in the MOT inspection manual, and counted once per failed test.
- Model names are as the DVSA recorded them. The merged families in the table are my own groupings.
- The main figures in this piece were worked out twice, by two separate programs written independently, and the two agreed.
- MOT tests on vehicles over 40 by make and model, 2025 (CSV)
All 293 models with 20 or more tests, as recorded, with the number and share that failed. - MOT tests on vehicles over 40 by postcode area, 2025 (CSV)
Every postcode area in Great Britain, with the fail rate and the rate per 10,000 tests. - MOT tests and fail rates by year of first use, 2025 (CSV)
Every year from 1930 to 2022, with the number tested and licensed for the older ones.
All three contain public sector information licensed under the Open Government Licence v3.0. Use them as you like, and a link back would be appreciated. The DVSA published the 2025 tests in June 2026, so I will run this again when the 2026 file arrives.
Welcome aboard. A confirmation is on its way to your inbox.
Share this article

Related Articles

GTA 6 cars in real life: the classics hiding in Vice City
Grand Theft Auto VI never uses a real car's name, so every motor in Vice City is a disguise. We went car-spotting through Rockstar's trailers and screenshots and found a Testarossa with a television past, a Ford Ranchero, a 1967 Mustang that has been off-roading and a Shelby Daytona Coupe. Here is what each one really is, what the real thing costs in Britain and which UK club to join.
Read More: GTA 6 cars in real life: the classics hiding in Vice City
Robert Pattinson's Bond car: why the books say a grey Bentley
Robert Pattinson is the new James Bond and nobody has said what he will drive. Ian Fleming had a firm view, though. In the books Bond's own car is always a battleship-grey Bentley, and the Aston Martin in Goldfinger was borrowed from the office car pool. Here are the cars Fleming gave Bond, the ones Fleming and Pattinson drove themselves, and what each one costs in Britain today.
Read More: Robert Pattinson's Bond car: why the books say a grey Bentley
Morris Minor Owners Club at 50 years: from a Scunthorpe pub to a summer of rallies
The Morris Minor Owners Club turned 50 in 2026. It started in a Scunthorpe pub, settled in Derby, and marked the year with Moggyfest, a rally at Sandringham, a week in Normandy and a national rally near Nottingham.
Read More: Morris Minor Owners Club at 50 years: from a Scunthorpe pub to a summer of rallies